Golang-GC笔记-GC-Traces
来源:https://www.ardanlabs.com/blog/2019/05/garbage-collection-in-go-part2-gctraces.html
开关GC的对比
有一个从不同的新闻提供商下载RSS并搜索的应用程序
在关闭GC的情况下测试并发请求应用程序耗时情况
1 | $ go build |
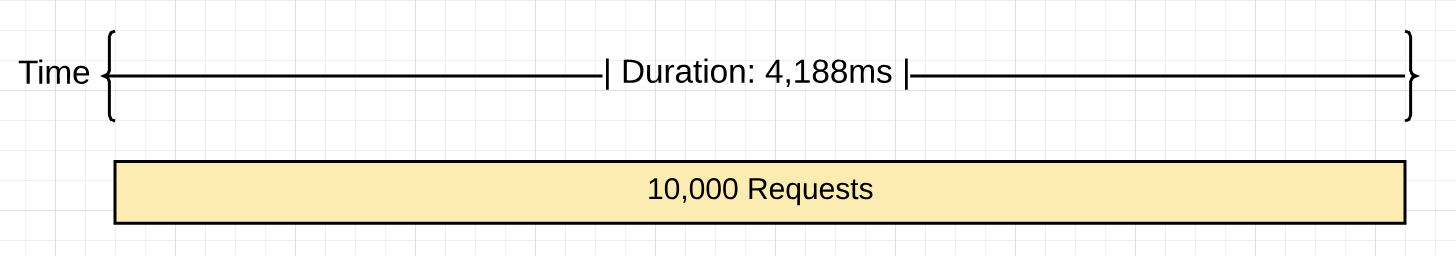
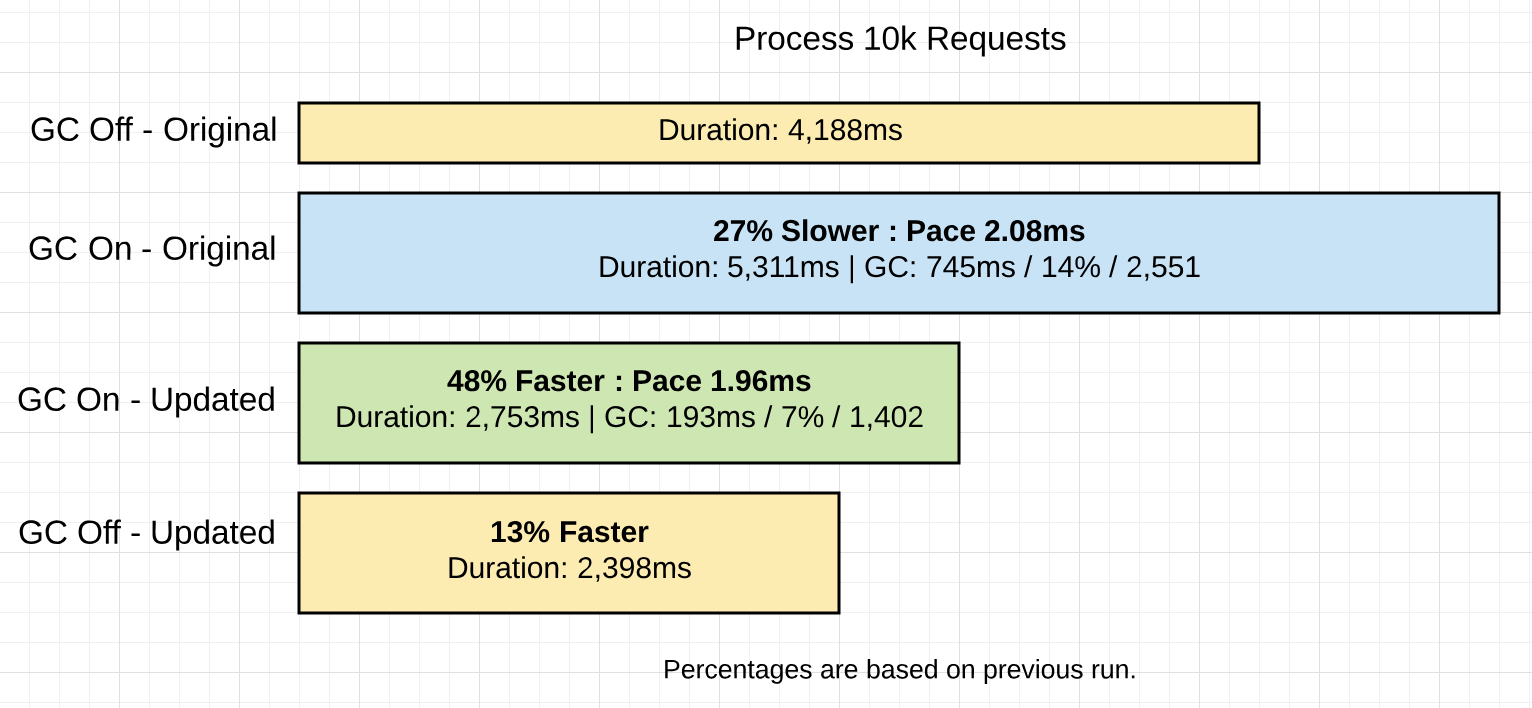
处理10k个请求需要4188ms,每秒处理约2387个请求
在开启GC的情况下呢,
1 | $ GODEBUG=gctrace=1 ./project > /dev/null |
共需要2551次gc(省略前两次还没有开始正式测试的gc数据)
1 | gc 2553 @8.452s 14%: 0.004+0.33+0.051 ms clock, 0.056+0.12/0.56/0.94+0.61 ms cpu, 4->4->2 MB, 5 MB goal, 12 P |
1 | Requests : 10,000 |
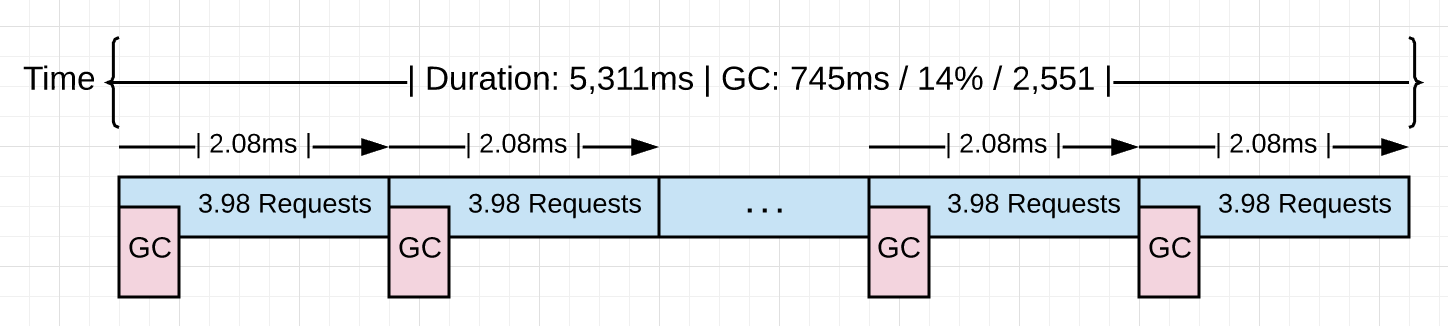
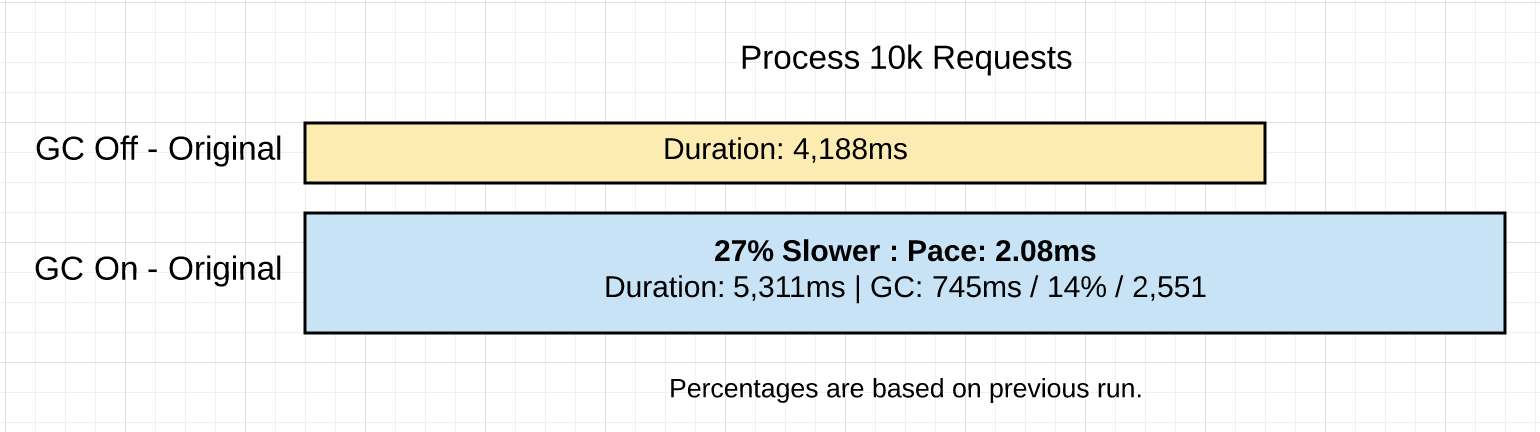
开启GC后耗费的时间增加了1.1s的延迟
减少分配
首先使用go的pprof工具查看内存使用情况
1 | import _ "net/http/pprof" |
使用top命令查看前6个分配内存最多的函数
1 | (pprof) top 6 -cum |
1 | (pprof) list rssSearch |
strings.ToLower会在堆上面创建新的字符串,循环调用是不需要的,可以放在循环外
改正之后重新测试一下
1 | $ go build |
1 | With Extra Allocations Without Extra Allocations |
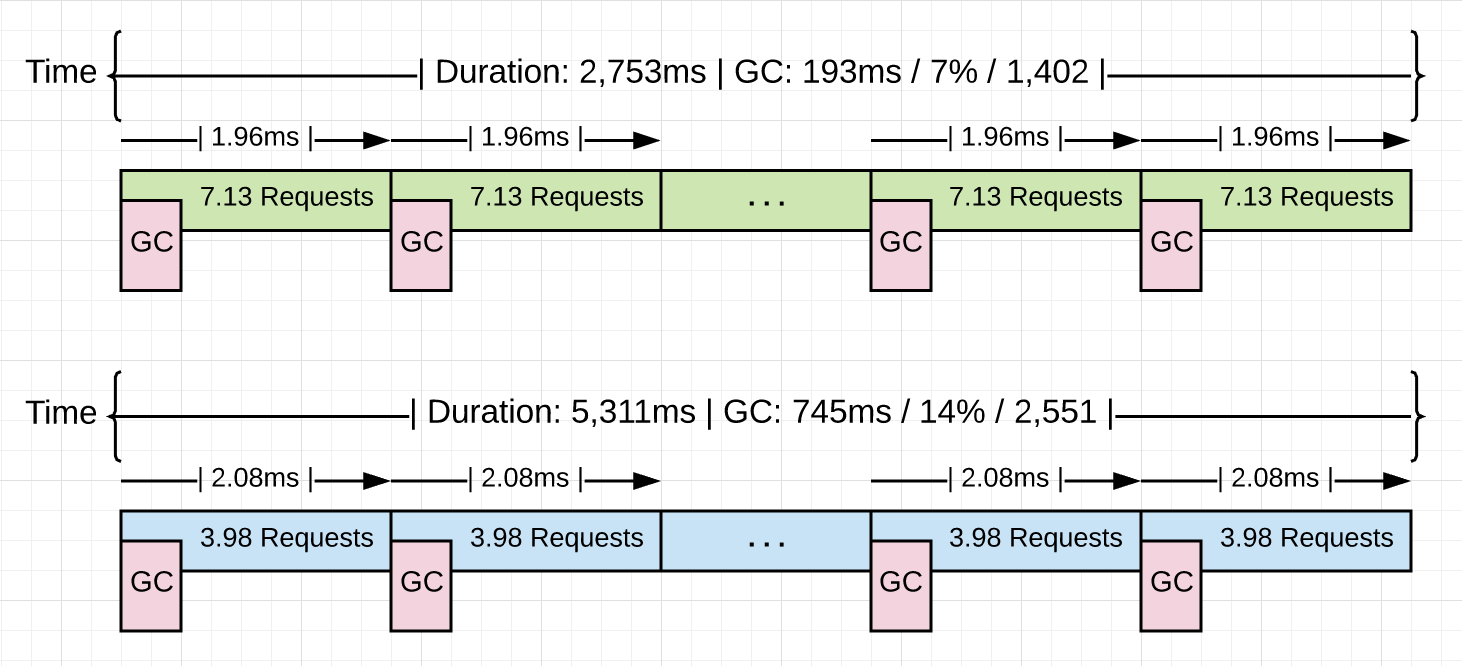
相比上一次减少了1149次GC,GC时间占比从14%下降到7%,程序运行速度提高了48%,collection时间减少74%
本博客所有文章除特别声明外,均采用 CC BY-NC-SA 4.0 许可协议。转载请注明来源 GreenHatHGのBlog!
相关推荐

2025-12-18
Golang-GC笔记-Semantics
来源:https://www.ardanlabs.com/blog/2018/12/garbage-collection-in-go-part1-semantics.html Garbage collectors responsibility tracking heap memory allocations freeing up allocations that are no longer needed keeping allocations that are still in-use As of version 1.12, the Go programming language uses a non-generational concurrent tri-color mark and sweep collector. 非分代并发三色标记和扫描收集器 Collector Behaviorcollection工作会经历三个阶段 Mark Setup - STW(Stop The World) Marking - Concurrent Mark Termination - STW...

2025-12-18
Golang笔记-Fan-in
来源:https://go.dev/talks/2012/concurrency.slide The boring function runs, like a boring party guest. 12345678910111213func boring(msg string) { for i := 0; ; i++ { fmt.Println(msg, i) time.Sleep(time.Duration(rand.Intn(1e3)) * time.Millisecond) }}func main() { go boring("boring!") fmt.Println("I'm listening.") time.Sleep(2 * time.Second) fmt.Println("You're boring; I'm leaving.")} A channel connects the main and bor...
2025-12-18
Golang反射应用-排序
一、反射Go基础教程可看 Go 系列教程 — 34. 反射 反射 Go 语言反射的实现原理 这里记下用的部分 1.1 reflect.Valuereflect.Value 可以表示一个任意类型的值 1234567891011121314151617181920package mainimport ( "fmt" "reflect")type User struct { Name string Age int}func main() { u := User{"张三", 56} v := reflect.ValueOf(u) fmt.Println(v)}/*output:{张三 56}*/ 1.2 reflect.Kind12345678910111213141516171819202122package mainimport ( "fmt" "reflect")type User struct
...

2025-12-18
Golang笔记-Pipelines-and-cancellation
来源:Go Concurrency Patterns: Pipelines and cancellation - The Go Programming Language What is pipeline receive values from upstream via inbound channels perform some function on that data, usually producing new values send values downstream via outbound channels Squaring numbers Generator Pattern converts a list of integers to a channel that emits the integers in the list 12345678910func gen(nums ...int) <-chan int{ out := make(chan int) go func() { for _, n := range nums{...
2025-12-18
火车头使用教程
声明:本教程无任何盈利目的,仅供学习使用,也不会对网站运行造成负担,请勿用于任何商业用途。 火车头简介火车采集器官网-网页抓取工具火车头采集器免费网站采集软件 火车采集器,一款专业的互联网数据抓取、处理、分析,挖掘软件,可以灵活迅速地抓取网页上散乱分布的数据信息,并通过一系列的分析处理,准确挖掘出所需数据。火车采集器历经十二年的升级更新,积累了大量用户和良好口碑,是目前最受欢迎的网页数据采集软件。 简单来讲,就是使用软件来简化我们的爬虫过程,在整一个过程中,不需要编写代码就能够实现爬虫逻辑。 举例爬取任务需要分页爬取所有页面,并对页面上所有感兴趣的条目进一步爬取二级URL 新建任务添加一个任务 网址采集规则-网址获取 起始网址填上【第一页的URL】 网址获取选项的意思:提取当前页面上想要爬取的条目的URL,比如xx网第一页上的符合条件的所有商品链接。 12345678910111213141516171819202122<div class="Z_list-box">...<div class="pic-box"...

2025-12-18
项目Golang优化点
一、前言最近接手的一个项目需要预先生成大量缓存(并不是一个好方案,最终ban掉了),在生成缓存处理数据中发现了一些优化点,可以提高速度,在此记录一下,首先可以了解一下如何利用工具找出代码中一些代码块的执行速度。 二、pprof2.1 简介google/pprof pprof 是用于可视化和分析性能分析数据的工具,这里主要用来定位性能问题 主要有以下数据: CPU Profiling:CPU 分析,按照一定的频率采集所监听的应用程序 CPU(含寄存器)的使用情况,可确定应用程序在主动消耗 CPU 周期时花费时间的位置 Memory Profiling:内存分析,在应用程序进行堆分配时记录堆栈跟踪,用于监视当前和历史内存使用情况,以及检查内存泄漏 Block Profiling:阻塞分析,记录 goroutine 阻塞等待同步(包括定时器通道)的位置 Mutex Profiling:互斥锁分析,报告互斥锁的竞争情况 这里我们主要用到第一点 2.2 结果分析这里使用的是web应用,可以使用 net/http/pprof库,它能够在提供 HTTP 服务进行分析 1go tool pp...
评论